
New York Times: Research & Development
- Apr 7, 2015
- 2 min read
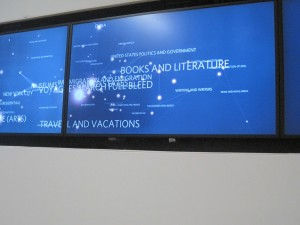
Noah Freehan was our guide on this tour of projects he had been working on and helped develop at New York Times R & D lab. The first project he showed us was a map of semantics accessed from the Times’ articling system. Noah told us how these articles were important because they are a slice of history recorded from the last 120 years. These articles don’t only contain facts from the past but also capture the culture at the time such as language used, topics and issues discussed. The map connected the articles through topics and tags developed for each topic and article. The purpose of this map was to examine the audience and determine the areas that most interested them. This kind of data representation used in this way is a tool for the New York Times to interpret the interests of the audience using the articling tag system.
The R & D department had several other projects which processed data from the audience who accessed the Times daily articles. These projects experimented with different ways of collecting this data and also visually representing it. One global model compiled user data such as rss feeds, and their location to represent the audience and what topic they were looking at on the NY Times website. This model had three modes which represented information in different ways. A few of these projects tracked buzzwords that users would use or search for to signal a trend in interest. This is how the company obtained the data to stay relevant to today’s society.
I was very impressed with the Times’ innovative efforts to identify and capture their audience using data collected electronically. This answer my questions about how an old established newspaper company is adapting to the digital age and obsolete qualities of the newspaper. It turns out that the New York Times had actually harnessed the power of the internet and data together to maintain their success. When I first heard that we were visiting New York Times I was skeptical, though their innovative ways of using and gathering data and also preserving data proves them as a worthy business leader in the future.
Noah showed us a few experimental projects. One was the Sound Table, which had a central microphone to record sound, and several touch sensitive strips on the surface which when touched, triggered a 60 second recording of the previous 30 seconds of conversation and the proceeding 30 seconds of conversation. This Sound Table displayed the text results on a monitor in normal conversation form. What was really interesting was the way the computer algorithm worked to capture buzzwords that the user said based on how important the particular word seemed in the context of the sentence. This AI almost replicates human recognition of language. These “watchwords” were underlined in bold to signal some kind of significance for the user to interpret.


Comments